See Everything. Fix Anything.
We implement full-stack observability with Prometheus, Grafana, Datadog, and OpenTelemetry — giving your team complete visibility into every request, metric, and log in your production environment.
What We Instrument
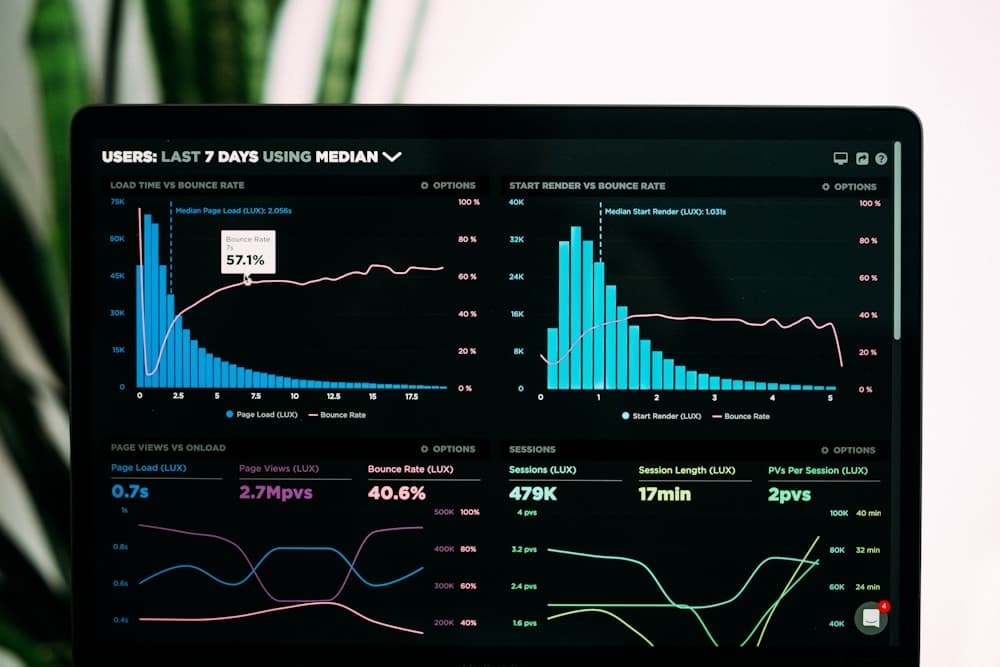
Full-Stack Observability
We implement end-to-end observability across your entire infrastructure — collecting metrics, logs, and distributed traces from every service so you see exactly what's happening in production at all times.
Intelligent Alerting & On-Call
We configure smart, noise-free alerting using PagerDuty and OpsGenie — eliminating alert fatigue with proper thresholds, anomaly-based triggers, and escalation policies so the right person is notified instantly.

Performance Optimization
Using continuous profiling and APM data to identify and eliminate performance bottlenecks in your application and database layers — reducing p99 latency and cutting infrastructure costs by 30–50%.
SLO & SLA Management
Defining Service Level Objectives and implementing error budgets — giving your engineering teams a data-driven framework to balance velocity with reliability and build the right features at the right time.

Our Observability Stack
How We Instrument
Instrumentation
Observability Setup
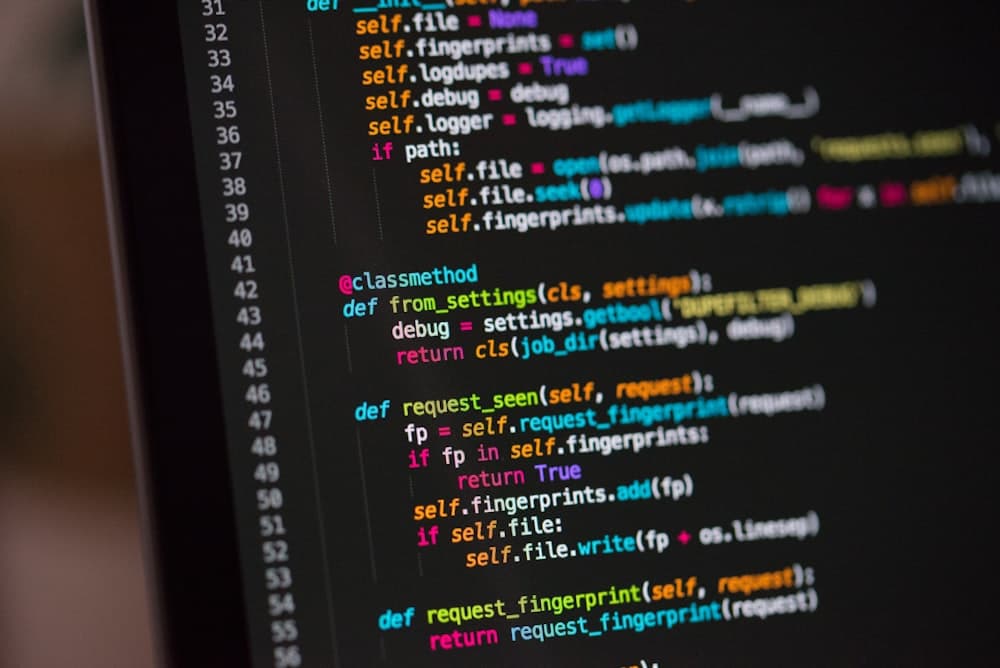
Deploying OpenTelemetry SDKs across all services to collect traces, metrics, and logs — with auto-instrumentation for Node.js, Python, Go, and Java workloads.
Dashboards
Visualization
Building executive and engineering dashboards in Grafana — with pre-built USE and RED method panels for every critical service, database, and infrastructure component.
Alerting Rules
Smart Alerts
Defining production-grade alerting rules using PromQL — with multi-window burn rate alerts for SLOs, anomaly detection, and dead man's switch patterns.
Runbooks
Automation
Creating automated runbooks and self-healing scripts — so common incidents are resolved automatically before your on-call engineer even sees an alert.
Not Your Typical Software House
Our real competition is the sea of software houses and agencies that overpromise and underdeliver. Here's what we do differently.
Senior Engineers, Not Outsourced Freelancers
Most software houses staff your project with whoever is free. We assign dedicated senior engineers who stay on your project from Sprint 0 to launch.
100% IP Ownership, Zero Vendor Lock-in
Every repository, database schema and design file belongs to you on delivery — no licensing fees, no dependency on us to keep running.
Weekly Sprint Demos, Not Radio Silence
You see working software every week, not a status email. Full visibility into what's being built and why, the whole way through.
Direct Access to Engineers, No Middlemen
You talk to the people writing the code — not an account manager relaying messages between you and an offshore team you never meet.
Frequently Asked Questions

Flying Blind in Production?
Tell us about your stack and we'll design a full observability solution — from metrics and logs to distributed tracing and SLO dashboards.
Set Up Observability